Case Study

Role
Sr. Product Designer
Full time
Team
Super app
4 members
Project
COVID-19
Scope
Experimenting
Customer Experience
Usability testing
A/B testing
Research
Overview
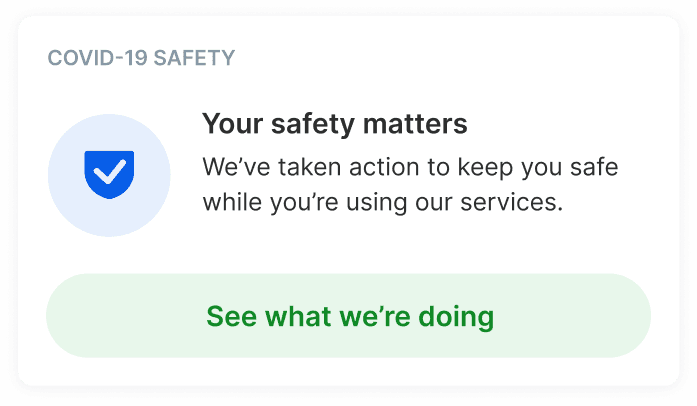
During the pandemic in March 2020, Pakistan and the MENA region went under lockdown. Customers could not hail a ride and the captain accepts the ride. Careem’s motive was to make sure the captain and their passengers feel safe and trusted.
Problem
Ride-hailing services faced a 100% downfall, when the world started to open up, only 20% of captain increment was achieved. We aimed to bring more rides onto the Careem system and achieve 50% by the end of the quarter. We created parameters in place for the captain which also reflects the customer’s app, which made sure the captain is safe from viruses.
Findings
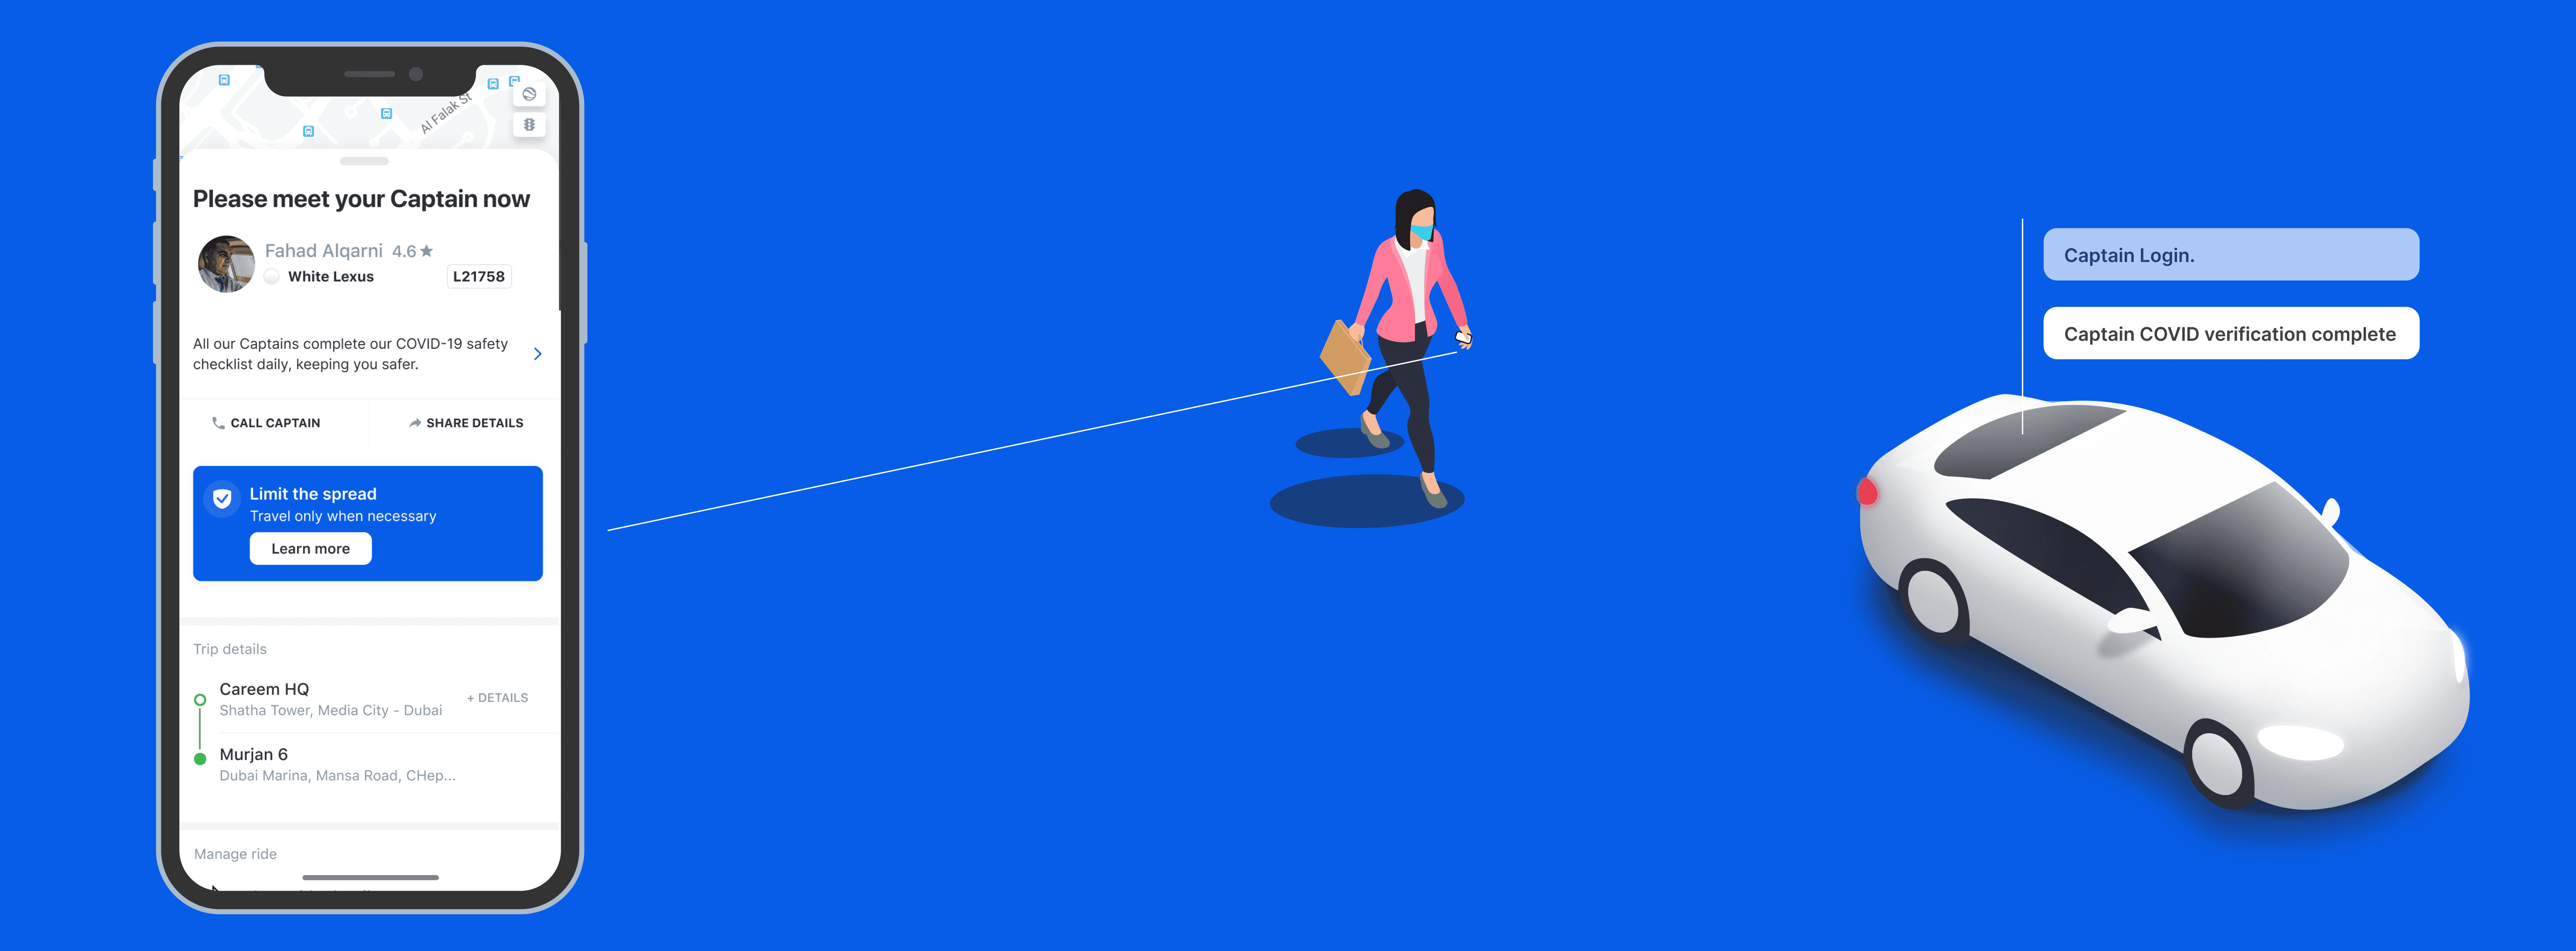
To understand the basic problem, we conducted interviews with the customer to understand their concerns when it comes to booking a ride. Also on how the captain is following the SOP. These interviews were done online with customers who gave us a brief understanding. Most users wanted their captains to select the SOP he/she has done and update the proof on the Careem App.

Empathy
Another problem captains were also facing, the number of rides was odd than the number of captains. To get the customers back to the app, the goal was to create trust between the customer and the captain. We developed a process for captains to assure their SOP. The user’s app reflected their landing screen, when booking a ride or also when the captain is selected. All information was accessible to the user when using the service.
Process
Keeping in mind to design something which is a quick win and solve the problem without any hustling iteration process. Therefore keeping it straightforward which users can understand it easily.

Validation
We have successfully conducted a high-fidelity design to test with 2500 users in Dubai in phase one later on in Karachi, and Cairo and see what feedback comes with it. As time moves on, A/B testing became wider and wider, reaching the sample size of 10,000 users.
Output
The user interaction level with the informative design was 78% before the ride. And users were spending more time discovering the information.
